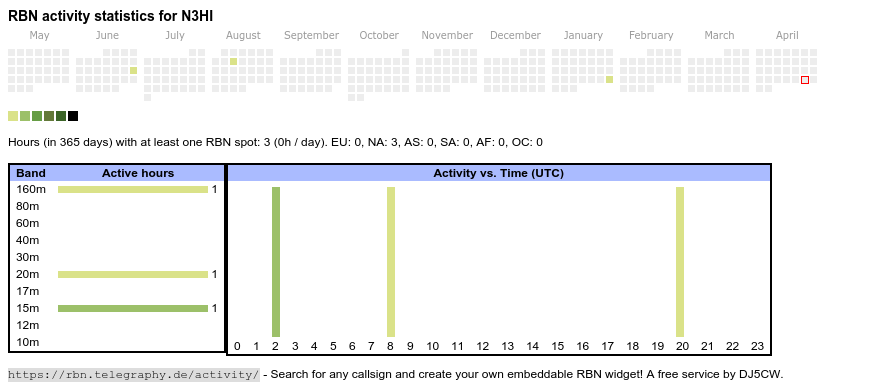
Hours (in 365 days) with at least one RBN spot: 3 (0h / day).
EU: 0, NA: 3, AS: 0, SA: 0, AF: 0, OC: 0
 This page requires JavaScript to work properly. QRZ.com disabled JavaScript for Iframes (see the announcement at qrz.com...
The heatmap shows the activity as reported by the RBN (CW/PSK/RTTY, no FT8) of the last 12 months. You can scroll back to January 2015.
Daily activity is measured by the number of active hour slots (24) times band slots (13, 160m - 2m incl. WARC and 60m) and the number of continents in which a skimmer spotted the station in the respective hour, for a maximum daily score of 24 * (13 + 6) = 456. When filtering by band, the continent information is omitted, because it's only saved once per hour slot, not per band.
Click a single day on the heatmap to see its details.
You can embed the statistics on your own website or profile on HamQTH/QRZ.com by copying the following HTML snippet: (example: DJ5CW on HamQTH.com - Click here for details.)
<a href="https://rbn.telegraphy.de/activity/N3HI"><img src="https://rbn.telegraphy.de/activity/image/N3HI"></a>
Thanks to PY1NB and the team of the Reverse Beacon Network for the aggregated RBN data.
Last modified: 2024-03-01 - Fabian Kurz, DJ5CW <fabian@fkurz.net> - Switch to http - Impressum / Datenschutz / Privacy Policy

